Three key questions for understanding shifts in global poverty
By Andy Sumner and Eduardo Ortiz-Juarez
In 2010 and the following years, there was attention to the fact that much of global poverty had shifted to middle-income countries (for example here, here, and here). The world’s poor hadn’t moved of course, but the countries that are home to large numbers of poor people had got better off on average and poverty hadn’t fallen as much as one might expect with economic growth in those countries moving from low-income to middle-income. There were also some big questions over the country categories themselves. One could say the world’s poor live not in the world’s poorest countries but in fast growing countries and countries with burgeoning domestic resources to address poverty albeit ‘locked’ by domestic political economy (who doesn’t want cheap petrol?)
This idea of the distribution of global poverty has more recently been revisited (here and here), just as it seems that global poverty has shifted back to low-income countries (LICs). Or has it? To get a better picture of global poverty trends, locations, and to understand the implications of the COVID-19 pandemic, we need to understand the limitations of the data.
What can’t the data tell us?
We are facing one big, and one monumental, data problem. First, there are no real data for poverty in India over the last decade—a country with a substantial impact on global poverty counts given its large population. Instead, the World Bank’s PovcalNet database extrapolates households’ consumption to compute poverty in India from 2011 to 2017 (not 2019, though why is not clear). Extrapolation is not unique to India’s data; the World Bank also infers poverty estimates of other countries if data for the reference year are not available. And there’s the rub. There is an underlying monumental problem. The World Bank has over 6,000 distributions in its database but only a third—about 2,000—are real survey data, so interpolation/extrapolation is endemic (see Figure 1 for details).
All the figures in this blog post are based on that World Bank’s PovcalNet database (one difference: we take the 2017 World Bank estimate of poverty in India and apply it to 2019). So, everything here is based on the ‘official’ database used by the Bank who to their credit make publicly available.
Can we objectively say how many people live in poverty?
The World Bank uses the $1.90-a-day poverty line whose determination relies heavily on two decades worth of Consumer Price Index (CPI) data for some of the world’s poorest countries. This is contentious since errors could change the overall value of the poverty line and change the poverty headcount. Every dime above the World Bank’s line adds on average almost 70 million more poor people. So, the global poverty count at $1.90 a day— almost 700 million people—rises by another 500 million people by the time one gets to $2.50 a day, which is the average poverty line of all developing countries (see Figure 2). Further, the headcount increases by a billion people moving from the $1.90 to the World Bank’s ‘moderate’ poverty line of $3.20 a day. This $3.20 threshold is important as it is also the poverty line closely associated with headcounts of multidimensional poverty and the average poverty line among lower middle-income countries (LMICs), where most of the world’s multidimensionally poor live.
In Figure 2 we also include $5.50, the average poverty line of upper middle-income countries (UMICs), and $13 a day, as this is the line associated with ‘permanent’ escape from poverty used by the World Bank in Latin America.
So where do the world’s poor live? Hint: it depends on who you count as ‘poor’
Mostly in Africa and, now in contrast to a decade ago, low-income countries once more, right? Well again, it depends on where you draw the line. Around the income/consumption poverty line correlated with multidimensional poverty counts ($3.20 a day), the world’s poor live in South Asia as much as in sub-Saharan Africa (see Figure 3). At the same time, if we use the World Bank’s moderate poverty line of $3.20, three quarters of the world’s poor remain in MICs (see Figure 4).
Then there’s the pandemic. We’ll never know for sure the impact of the pandemic on poverty, as we’d need surveys for a large number of developing countries before as well as after, and those just don’t exist. Moreover, the pandemic is ongoing and could shape the prospects for growth and poverty reduction in developing countries for the next five to ten years given the slow and unequal global distribution of vaccines.
Figure 5 shows various scenarios of how much the poverty count in middle-income countries could have risen due to the pandemic. Our purpose is not to predict one precise poverty outcome but to show what different income shocks to those near the poverty line imply in terms of potential poverty impact in the absence of compensatory policy intervention. We thus use a set of universal, arbitrary shocks to estimate the extent of precarity.
In short, we are highlighting the fragility of progress on poverty reduction in the current pandemic context given the characteristics of the responses to the pandemic—i.e. lockdowns—combined with pre-existing conditions of high levels of informality of employment and the weaker coverage of social protection in the informal sector.
Our study illustrates the following: if the income shock is of this magnitude, the effect on poverty could be dramatic. What is evident is that millions of people in MICs live not that far above the $1.90-a-day poverty line (and the $3.20 poverty line) and thus could easily fall (back) into poverty as a result of disrupted economic activity due to lockdowns or ill health.
Why does this all matter? There are three reasons why
First, shockingly, we don’t really know how much income poverty there is in the world due to the missing India data. Of course, we do have multidimensional poverty estimates (at a global level the headcount could be double that of $1.90-a-day poverty).
Second, just because the data tells us that extreme poverty, at $1.90 a day, has moved back to LICs (at least prior to the pandemic), much of the global poverty remains in MICs. In fact, three quarters of the global poor at the $3.20 line are living in MICs, even if measured before the pandemic.
Third, the pandemic itself has rendered millions of people in MICs who are living just above the $1.90-a-day poverty line at risk of falling back, meaning the global poverty headcount could rise, and stop-start economic growth in the next few years could leave poverty rates higher.
What is clear from the pandemic is that every country will need a universal (probably annual) vaccination programme. And yet the Global South—with some exceptions, notably India and China as vaccine producers—is unlikely to have fair and equal access to the global supply of vaccines to achieve universal coverage.
Consequentially, economic growth and poverty reduction will likely proceed in starts and stops as infection waves peak and trough. Even the vaccines that do reach the Global South will need to be paid for and require state capacity to deliver. That could mean the diversion of public spending and state capacity away from social spending and poverty reduction. The immediate impact of the pandemic has led to an expansion of social safety nets and policies, these need to become permanent and universal in the years ahead beyond the impact of the pandemic’s first phase if poverty is to be reduced and the Sustainable Development Goals ever met.
All charts are by Sumner, Ortiz-Juarez and Hoy (2022): calculation based on World Bank’s PovcalNet Database. March 2021 update. World Bank’s PovcalNet data based on actual surveys and based on extrapolation/interpolation
Note: This article was first published on the blog of UNU-WIDER. It gives the views of the authors, not the position of the EADI Debating Development Blog or the European Association of Development Research and Training Institutes.
Andy Sumner is Professor of International Development at King’s College London, and Director of the Economic and Social Research Council (ESRC) Global Challenges Strategic Research Network on Global Poverty and Inequality Dynamics. He is also a Non-Resident Senior Research Fellow at UNU-WIDER.
Eduardo Ortiz-Juarez is a Lecturer in Development Economics in the Department of International Development at King’s College London, with a particular interest in the study of poverty dynamics, inequalities, social policy, and green development.
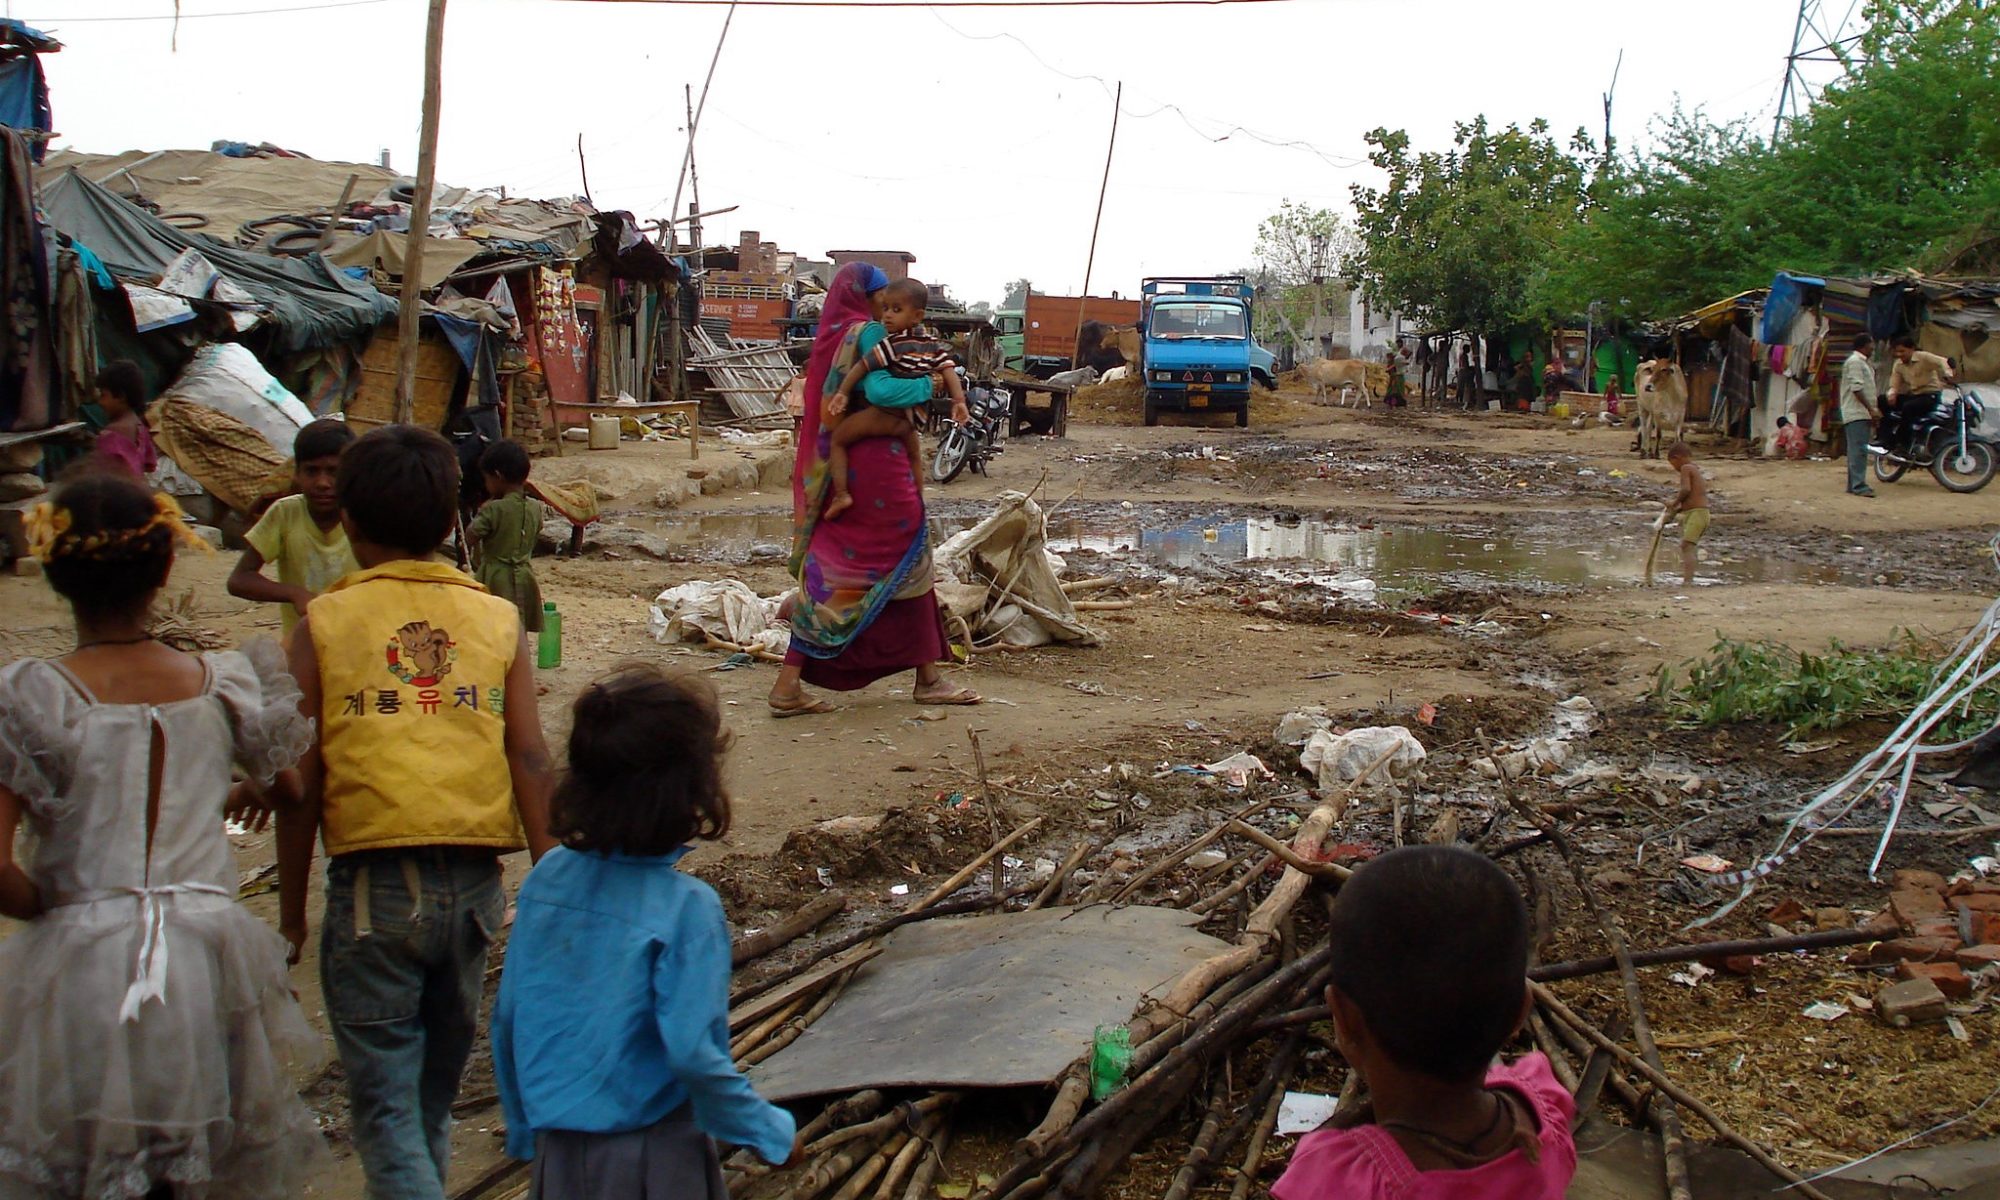
Image: The Advocacy Project under a Creative Commons Licence on Flickr

